Project-based Learning Information: Functional Programming 2026
On this page
- Smart Soil IoT
- KalimantanBio: Biodiversity Knowledge Platform
- Aerial Analytics Platform
- Module 1: Aerial Image & Project Manager
- Module 2: Plugin System & Extension Manager
- Module 3: Aerial Image Map Explorer
- Module 4: RGB Vegetation Detection Plugin
- Module 5: Vegetation Coverage Analytics
- Module 6: RGB Vegetation Condition Analysis
- Module 7: Tree Detection & Counting Plugin
- Module 8: RGB Land-Cover Classification Plugin
- Module 9: Area & Plot Analytics
- Module 10: Simple Temporal Change Analysis
- Module 11: Aerial Analytics Dashboard & Reporting
Smart Soil IoT
Soil Monitoring System for Peatland Agriculture with Intelligent Decision Support
Lecturer’s Main Task: Ensure that the project and its outcomes are verifiable, ensure that functional thinking has been properly implemented throughout the development process, identify opportunities for scientific publication when sufficient novelty is present, and provide opportunities for students who make substantial inventive contributions to be involved in potential patent applications
Technology: Axum + Python (only if necessary)
Module 1: Soil Sensor Acquisition and Validation
Concern: How can we acquire reliable soil data in peatland conditions and implement the IoT?
Main features:
- Selection of soil sensors (moisture, temperature, pH, EC)
- Robust sensor node hardware and enclosure
- Calibration and validation workflows
Possible tasks:
- Select required sensors and design the sensor node
- Implement waterproofing and moisture protection
- Design anti-theft enclosures and installation mechanisms
- Implement sensor calibration and automated recalibration
- Apply noise filtering and outlier detection
- Produce validated, documented soil data
Main responsibilities:
- Ensure sensor data accuracy and reliability
- Deliver validated data suitable for analytics
- Provide documentation for calibration and deployment
Recommended minimum parameters:
- Soil moisture
- Soil temperature
- Soil pH
- Electrical conductivity (EC)
Module 2 — IoT Communication, Edge Processing, and User Management
Concern: How can validated sensor data be transmitted reliably and securely from the field?
Main features:
- ESP32-based edge nodes with MQTT/HTTP connectivity
- Offline buffering and automatic reconnection
- Device identification and device–user ownership mapping
- Basic authentication and role-based access control
- Sampling interval control and edge anomaly checking
Possible tasks:
- Implement MQTT/HTTP connectivity with retry logic
- Build offline buffering and upload-on-reconnect behavior
- Implement device provisioning and identification
- Design device–user ownership mapping and access controls
- Add authentication and role management
- Implement sampling interval controls and edge anomaly detection rules
Main responsibilities:
- Ensure reliable, secure transmission of validated sensor data
- Protect data integrity and device access
- Manage device lifecycle and user ownership
Module 3 — Soil Data Platform and Visualization
Concern: How can soil conditions be monitored and understood over time?
Main features:
- IoT data ingestion pipeline (IoT → REST API → Database → Time-series processing)
- Time-series processing and aggregation for trend analysis
- Web dashboard for visualization and monitoring
Dashboard items:
- Current moisture
- Soil temperature
- pH
- Electrical conductivity (EC)
- Historical graphs and trend views
- Device status and sensor health
- Location and plot metadata
- Warning history and alerts
- Comparison between plots
Possible tasks:
- Implement REST API and data storage
- Build time-series processing and aggregation jobs
- Develop dashboard views, visualizations and comparison tools
- Implement alerts and filtering
Main responsibilities:
- Present accessible, actionable views of soil conditions
- Provide historical context and alerts for stakeholders
Module 4 — Soil Analytics and Decision Support
NO DEEP LEARNING for this!
Concern: What does the sensor data actually mean?
Main features / pipeline:
- Historical + current data collection
- Feature processing and aggregation
- Soil analytics (statistical / rules-based)
- AI / rules-based inference
- Risk, prediction, and recommendation outputs
Possible tasks:
- Anomaly detection on sensor streams
- Soil-condition classification (rule-based or statistical)
- Waterlogging and excessive-dryness risk scoring
- pH change and EC anomaly detection
- Trend prediction and irrigation recommendation
- Provide confidence/uncertainty estimates for recommendations
Main responsibilities:
- Turn validated sensor data into actionable risk scores and recommendations
- Prefer interpretable, reproducible analytics (no deep learning)
- Surface uncertainty and provenance for decisions
Module 5 — Plant-Specific Expert System
Concern: How can the system translate general soil conditions into plant-specific assessments and recommendations?
Main features:
- Plant-specific soil requirement definitions and thresholds
- Rule-based expert representation and inference engine
- Support for growth-stage specific rules and thresholds
- Explainable recommendations with provenance metadata
Possible tasks:
- Define plant-specific parameter thresholds and rule sets
- Implement a rule authoring, validation and revision interface
- Build an inference engine to evaluate rules consistently
- Attach provenance metadata and explanation to each recommendation
Main responsibilities:
- Translate general soil measurements into plant-specific guidance
- Ensure recommendations are explainable and traceable
- Provide tools for experts to validate and revise rules
Module 6 — Plugin Framework and Extensibility
Concern: How can the soil monitoring platform be extended with new plants, analytics methods, expert rules, or models without modifying the core system?
Main features:
- Plugin interface and lifecycle management
- Plugin registration, discovery, and metadata
- Enable/disable controls and compatibility validation
- Support for analytics, AI model, and plant-rule plugins
Possible tasks:
- Design plugin API and metadata schema
- Implement registration, discovery, and compatibility checks
- Provide plugin enable/disable and versioning controls
- Create demonstration plugins (analytics, expert rules, plant modules)
Main responsibilities:
- Allow safe extensibility of the platform via plugins
- Maintain core stability while enabling experimentation
- Provide clear metadata and compatibility guarantees for plugins
KalimantanBio: Biodiversity Knowledge Platform
KalimantanBio Spesies Repository
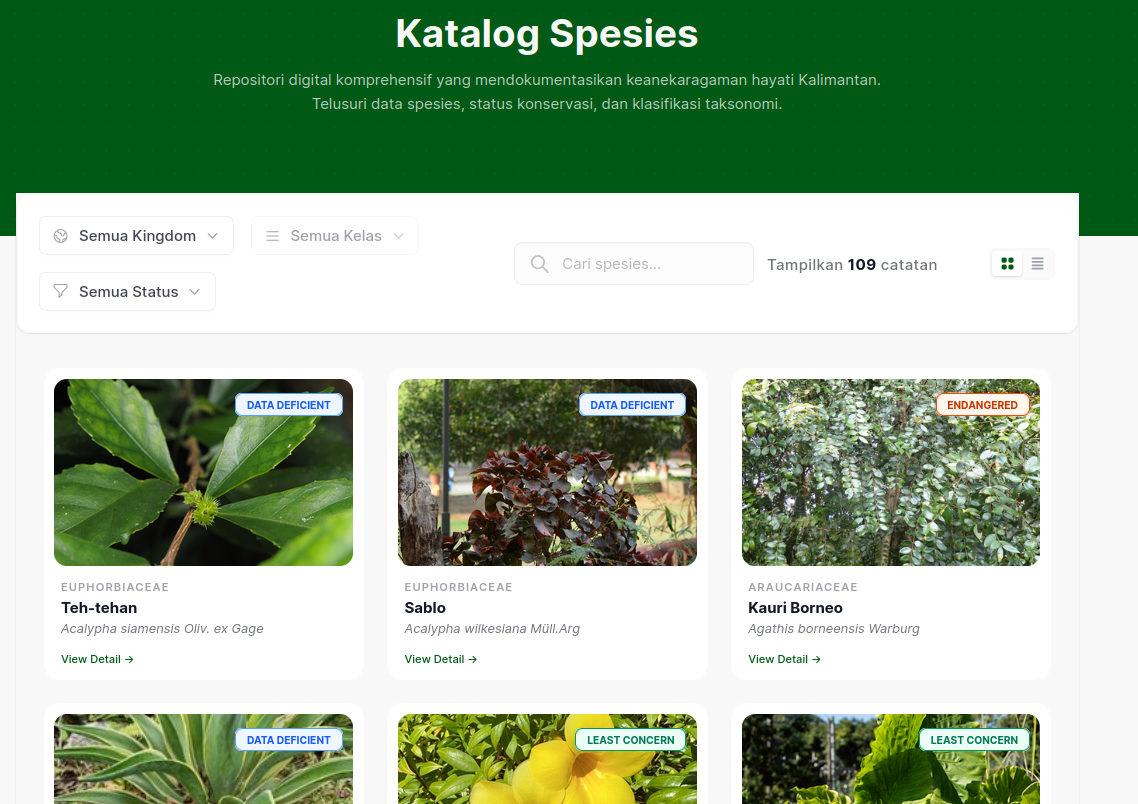
Lecturer’s Main Task: Ensure that the project and its outcomes are verifiable, ensure that functional thinking has been properly implemented throughout the development process, ensure that the project is ready for production on kalimantanbio.com/repository/
Technology: Axum + Django (For interface and light computation)
Module 1: Intelligent Species Search
Develop an intelligent search system that allows users to discover species using natural-language queries and multiple biodiversity attributes.
Possible features:
- Natural-language species search — Accept queries such as “plants found in wetlands with medicinal uses.”
- Multi-attribute search & filtering — Search and filter species using taxonomy, habitat, conservation status, morphology, uses, and other available attributes.
- Relevance ranking — Score and rank species according to how well they match the user’s query.
- Related-query recommendation — Generate and rank follow-up biodiversity queries based on the current query and retrieved species attributes.
Module 2: Species Relationship Explorer
Develop an interactive system for discovering and exploring relationships among species based on taxonomy, habitat, characteristics, and other biodiversity attributes.
Possible Features:
- Related Species Discovery: Identify and recommend species that are related to a selected species based on available biodiversity attributes.
- Relationship Scoring: Calculate the strength of relationships between species based on shared taxonomy, habitat, characteristics, and other attributes.
- Relationship Explanation: Explain why species are considered related, such as sharing the same genus, habitat, or ecological characteristics.
- Interactive Species Network: Visualize species as nodes and their relationships as edges, allowing users to interactively explore connected species.
Module 3: Taxonomy & Classification Explorer
Develop an interactive taxonomic exploration system that helps users understand the diversity, classification, and taxonomic composition of species found in Kalimantan.
Possible Features:
-
Interactive Taxonomic Tree: Explore species through hierarchical taxonomic levels such as order, family, genus, and species.
-
Taxon-Based Species Explorer: Select a family, genus, or other taxonomic group and explore species belonging to that group in Kalimantan.
-
Taxonomic Diversity Overview: Summarize the number of families, genera, and species represented in KalimantanBio for a selected taxonomic group.
-
Taxonomic Coverage Analysis: Compare species recorded in KalimantanBio with available reference checklists to identify represented and missing taxa.
-
Taxonomic Gap Explorer: Identify families or genera that are poorly represented in KalimantanBio and may require further data collection.
-
Endemic Taxa Explorer: Explore taxonomic groups containing species that are endemic or locally restricted to Kalimantan or Borneo.
-
Taxonomic Distribution Summary: Show how members of a selected taxonomic group are distributed across regions of Kalimantan.
-
Synonym and Accepted Name Explorer: Connect taxonomic synonyms and historical scientific names with currently accepted names.
Recommended Priority:
- Interactive Taxonomic Tree
- Taxon-Based Species Explorer
- Taxonomic Coverage Analysis
- Endemic Taxa Explorer
- Taxonomic Gap Explorer
Module 4: Comparative Species Explorer
Develop an interactive comparison system that helps users understand similarities, differences, uniqueness, and ecological characteristics among species found in Kalimantan.
Possible Features:
-
Multi-Species Comparison: Select multiple species and compare their taxonomy, morphology, habitat, distribution, conservation status, and other available attributes.
-
Shared and Unique Attribute Analysis: Identify characteristics shared among selected species and characteristics unique to individual species.
-
Species Similarity Scoring: Calculate similarity between species using taxonomy, morphology, habitat, distribution, and other biodiversity attributes.
-
Distinguishing Characteristics Explorer: Identify the characteristics that most clearly differentiate one species from another.
-
Habitat Comparison: Compare the habitat preferences and ecological environments associated with selected species.
-
Distribution Comparison: Compare the known geographic distributions of selected species across Kalimantan.
-
Conservation Status Comparison: Compare conservation status, endemicity, rarity, and other available conservation-related information.
-
Similar Species Discovery: Identify species in KalimantanBio that are most similar to a selected species.
-
Comparative Visualization: Present similarities and differences using tables, charts, attribute matrices, or other interactive visualizations.
-
Comparative Summary: Generate a structured summary explaining the most important similarities and differences among selected species.
Recommended Priority:
- Multi-Species Comparison
- Shared and Unique Attribute Analysis
- Distinguishing Characteristics Explorer
- Species Similarity Scoring
- Similar Species Discovery
Module 5: Biodiversity Knowledge & Citation Explorer
Develop a scientific knowledge exploration system that connects Kalimantan biodiversity species with publications, research topics, locations, and supporting scientific references.
Possible Features:
-
Species-to-Publication Explorer: Discover scientific publications, reports, and other references associated with a selected species.
-
Research Topic Explorer: Explore publications according to biodiversity topics such as taxonomy, ecology, conservation, ethnobotany, habitat, and species identification.
-
Research Location Explorer: Explore biodiversity research based on study locations such as provinces, regencies, forests, conservation areas, and other locations across Kalimantan.
-
Species Research Timeline: Explore how research on a species or taxonomic group has developed over time.
-
Research Coverage Analysis: Measure and compare how extensively different species, genera, families, topics, or locations have been studied.
-
Understudied Species Explorer: Identify species or taxonomic groups with limited scientific literature available in KalimantanBio.
-
Biodiversity Knowledge Network: Visualize relationships among species, publications, research topics, study locations, and researchers.
-
Citation Recommendation: Recommend relevant scientific references when users explore a species or biodiversity topic.
-
Citation Export: Export selected references into common citation formats for academic writing and reference managers.
Recommended Priority:
- Species-to-Publication Explorer
- Research Topic Explorer
- Research Location Explorer
- Research Coverage Analysis
- Understudied Species Explorer
Aerial Analytics Platform
The Aerial Analytics Platform is designed to process and analyze RGB aerial imagery captured using standard drones. The platform uses a plugin-based architecture so that analytical capabilities can be added independently without modifying the core system.
Lecturer’s Main Task: Ensure that the project and its outcomes are verifiable, ensure that functional thinking has been properly implemented throughout the development process, ensure that the project is ready for open source development
Technology: Blueprint.js (for interface and light computation) + Tauri + Python (If necessary for AI)
Module 1: Aerial Image & Project Manager
Develop the core system for organizing aerial imagery, projects, acquisition sessions, and associated metadata.
Possible Features:
- Project Management: Create, update, and organize aerial monitoring projects.
- RGB Image Import: Import and organize aerial images captured using standard drones.
- Image Metadata Extraction: Extract available metadata such as GPS coordinates, acquisition date, altitude, and image resolution.
- Flight Session Management: Organize images according to flight or acquisition sessions.
- Image Quality Checking: Identify images with blur, poor exposure, or missing metadata.
- Dataset Summary: Provide statistics about images and acquisition sessions.
Module 2: Plugin System & Extension Manager
Develop a plugin architecture that allows analytical capabilities to be installed, registered, configured, executed, enabled, disabled, and removed without modifying the core platform.
Possible Features:
- Plugin Interface Definition: Define a standard interface that all analytical plugins must follow.
- Plugin Registration: Register plugin name, version, description, supported input, and output.
- Plugin Discovery: Automatically detect available plugins.
- Plugin Installation: Allow users to add new plugins to the platform.
- Plugin Enable and Disable: Activate or deactivate plugins without deleting them.
- Plugin Configuration: Allow each plugin to expose configurable parameters.
- Plugin Execution: Execute plugins using standardized image, project, or area-of-interest inputs.
- Plugin Result Handling: Receive and standardize plugin outputs.
- Plugin Error Isolation: Prevent a failed plugin from crashing the core platform.
- Plugin Information Viewer: Display installed plugins and their capabilities.
Module 3: Aerial Image Map Explorer
Develop an interactive geospatial environment for exploring aerial images and their associated locations.
Possible Features:
- Geo-Referenced Image Explorer: Display aerial images according to their GPS locations.
- Image Location Marker: Show where each image was captured.
- Area of Interest Selection: Allow users to define specific areas for analysis.
- Layer Management: Display imagery, boundaries, annotations, and analytical results.
- Spatial Measurement: Measure distance, area, and perimeter.
- Spatial Annotation: Mark and annotate locations or areas of interest.
Module 4: RGB Vegetation Detection Plugin
Develop a plugin for identifying vegetation from standard RGB aerial imagery.
Possible Features:
- Vegetation Detection: Separate vegetation from non-vegetation areas.
- RGB Vegetation Indices: Apply RGB-based indices such as ExG, ExR, or VARI.
- Vegetation Mask Generation: Generate vegetation masks from aerial imagery.
- Green Pixel Analysis: Analyze vegetation based on RGB color characteristics.
- Detection Threshold Configuration: Allow users to adjust detection parameters.
- Detection Visualization: Generate results that can be displayed by the platform.
- Plugin-Compatible Output: Return standardized masks, statistics, and metadata.
Module 5: Vegetation Coverage Analytics
Develop a system for quantifying vegetation coverage using outputs from the RGB Vegetation Detection Plugin.
Possible Features:
- Vegetation Coverage Estimation: Calculate the percentage of an area covered by vegetation.
- Vegetation Area Calculation: Estimate total vegetation-covered area.
- Coverage Classification: Categorize areas into low, medium, or high vegetation coverage.
- Coverage Zonation: Divide study areas according to vegetation coverage.
- Plot-Based Coverage Analysis: Calculate vegetation coverage for individual plots.
- Multi-Plot Comparison: Compare vegetation coverage among selected plots.
- Coverage Visualization: Display vegetation coverage statistics and spatial results.
Module 6: RGB Vegetation Condition Analysis
Develop a system for analyzing visible vegetation conditions using RGB color information.
Possible Features:
- Green Intensity Analysis: Analyze differences in vegetation greenness.
- Vegetation Color Analysis: Analyze RGB color characteristics of detected vegetation.
- Vegetation Condition Classification: Categorize vegetation into visual condition classes.
- Yellowing Detection: Identify vegetation areas showing visible yellowing.
- Browning Detection: Identify vegetation areas showing browning or dry appearance.
- Condition Zonation: Divide areas according to visually derived vegetation conditions.
- Plot Condition Comparison: Compare vegetation conditions among selected plots.
Module 7: Tree Detection & Counting Plugin
Develop a computer vision plugin for detecting and counting visible trees from aerial RGB imagery.
Possible Features:
- Tree Detection: Detect individual trees or tree crowns.
- Tree Counting: Calculate the total number of detected trees.
- Confidence Filtering: Filter detections according to prediction confidence.
- Tree Location Mapping: Return spatial locations of detected trees.
- Area-Based Tree Counting: Count trees within selected plots.
- Tree Density Analysis: Calculate tree density per unit area.
- Detection Review: Allow users to inspect and correct detections.
- Plugin-Compatible Output: Return standardized detections, counts, coordinates, and confidence values.
Module 8: RGB Land-Cover Classification Plugin
Develop a plugin for classifying visible land-cover types from standard RGB aerial imagery.
Possible Features:
- Land-Cover Classification: Classify visible areas into vegetation, bare soil, water, built areas, or other relevant classes.
- Custom Class Definition: Allow projects to define suitable land-cover categories.
- Land-Cover Mask Generation: Generate classified masks from aerial images.
- Class Area Calculation: Calculate the area occupied by each land-cover class.
- Land-Cover Percentage: Calculate the proportion of each class within a selected area.
- Plot-Based Land-Cover Analysis: Compare land-cover composition among selected plots.
- Land-Cover Map Generation: Produce classification results that can be displayed on the platform.
- Plugin-Compatible Output: Return standardized land-cover classes, masks, statistics, and metadata.
Module 9: Area & Plot Analytics
Develop a spatial analytical system for defining plots and summarizing analytical results within them.
Possible Features:
- Plot Definition: Create or import plot boundaries.
- Area Calculation: Calculate plot area and perimeter.
- Analysis by Plot: Aggregate analytical results within individual plot boundaries.
- Plot Statistics: Calculate summary statistics for each plot.
- Multi-Plot Comparison: Compare indicators among different plots.
- Plot Ranking: Rank plots according to selected analytical indicators.
- Plot Summary: Generate a structured analytical summary for each plot.
Module 10: Simple Temporal Change Analysis
Develop a system for comparing RGB aerial observations captured at different times.
Possible Features:
- Multi-Date Image Management: Organize aerial observations according to acquisition date.
- Before-and-After Comparison: Compare imagery from two observation periods.
- Vegetation Coverage Change: Calculate changes in vegetation coverage.
- Land-Cover Change: Identify visible land-cover changes.
- Tree Count Change: Compare detected tree counts between observation periods.
- Change Magnitude Analysis: Calculate the amount of observed change.
- Change Area Detection: Identify locations where significant change has occurred.
- Change Visualization: Display before-and-after imagery and analytical results.
Module 11: Aerial Analytics Dashboard & Reporting
Develop an integrated interface for summarizing and communicating results produced by the platform and installed plugins.
Possible Features:
- Project Analytics Dashboard: Display important indicators for each project.
- Plugin Result Dashboard: Display outputs generated by installed analytical plugins.
- Analysis Result Summary: Summarize results from vegetation, tree, land-cover, plot, and temporal modules.
- Plot Comparison Dashboard: Compare analytical indicators among selected plots.
- Temporal Summary: Present changes across observation periods.
- Interactive Result Explorer: Connect analytical summaries with corresponding images and locations.
- Charts and Statistics: Present analytical results using charts and summary statistics.
- Report Generation: Generate structured reports containing maps, figures, and analytical results.
- Data Export: Export results for GIS, statistical, or further research analysis.